When leaders can clearly see what is happening across their organization, they can make better decisions with greater confidence.

Reports take days or weeks to produce

Leadership waits until month-end to understand performance
Critical information lives in multiple systems

Teams spend too much time compiling data

Different reports show different numbers

Opportunities and risks are identified too late

Understand what is happening across your organization in real time.

Trust the information used to make decisions.

Align teams around shared metrics and goals.
Bring data together from all your business systems, including operational software and spreadsheets.
Centralize, validate, and structure data into a trusted reporting environment.
Transform data into dashboards and reports that reveal meaningful insights.
Leaders gain the visibility and confidence to make better decisions every day.
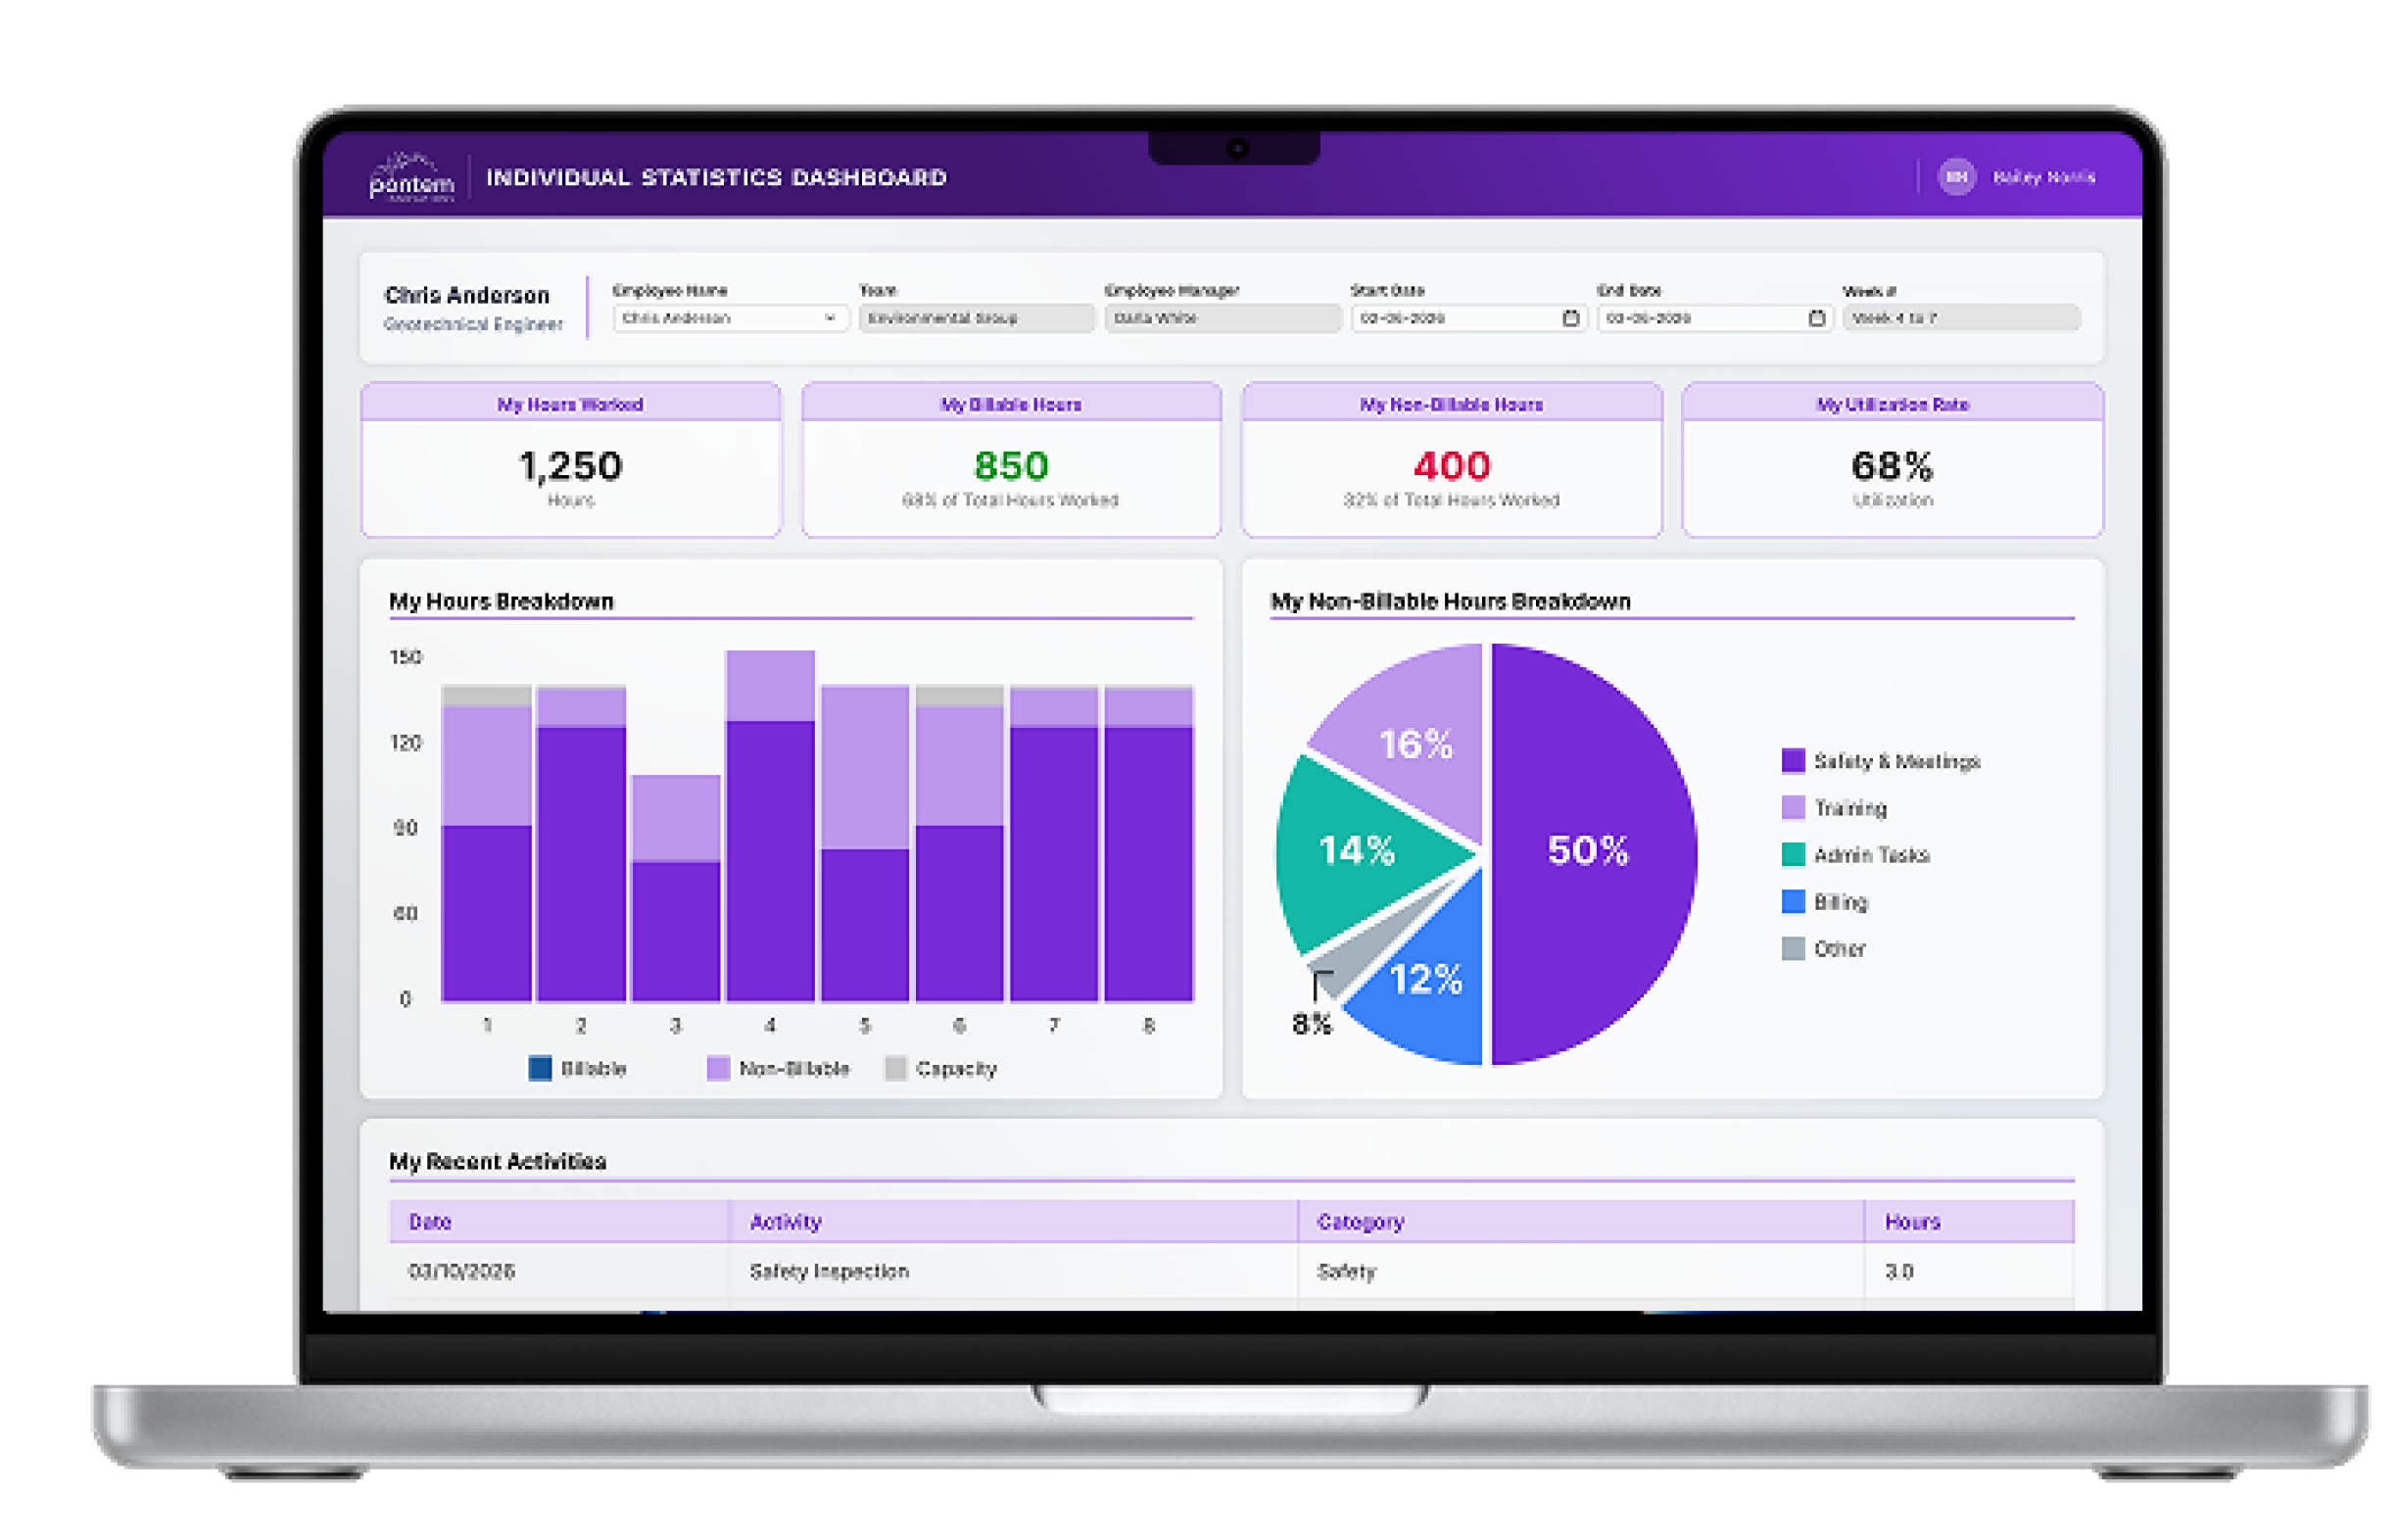
A Clear View of Organizational Performance
Executive dashboards bring your most important metrics together in one place, giving leaders real-time visibility into organizational performance. Rather than waiting for month-end reports, teams can quickly identify issues, monitor trends, and make informed decisions with confidence.
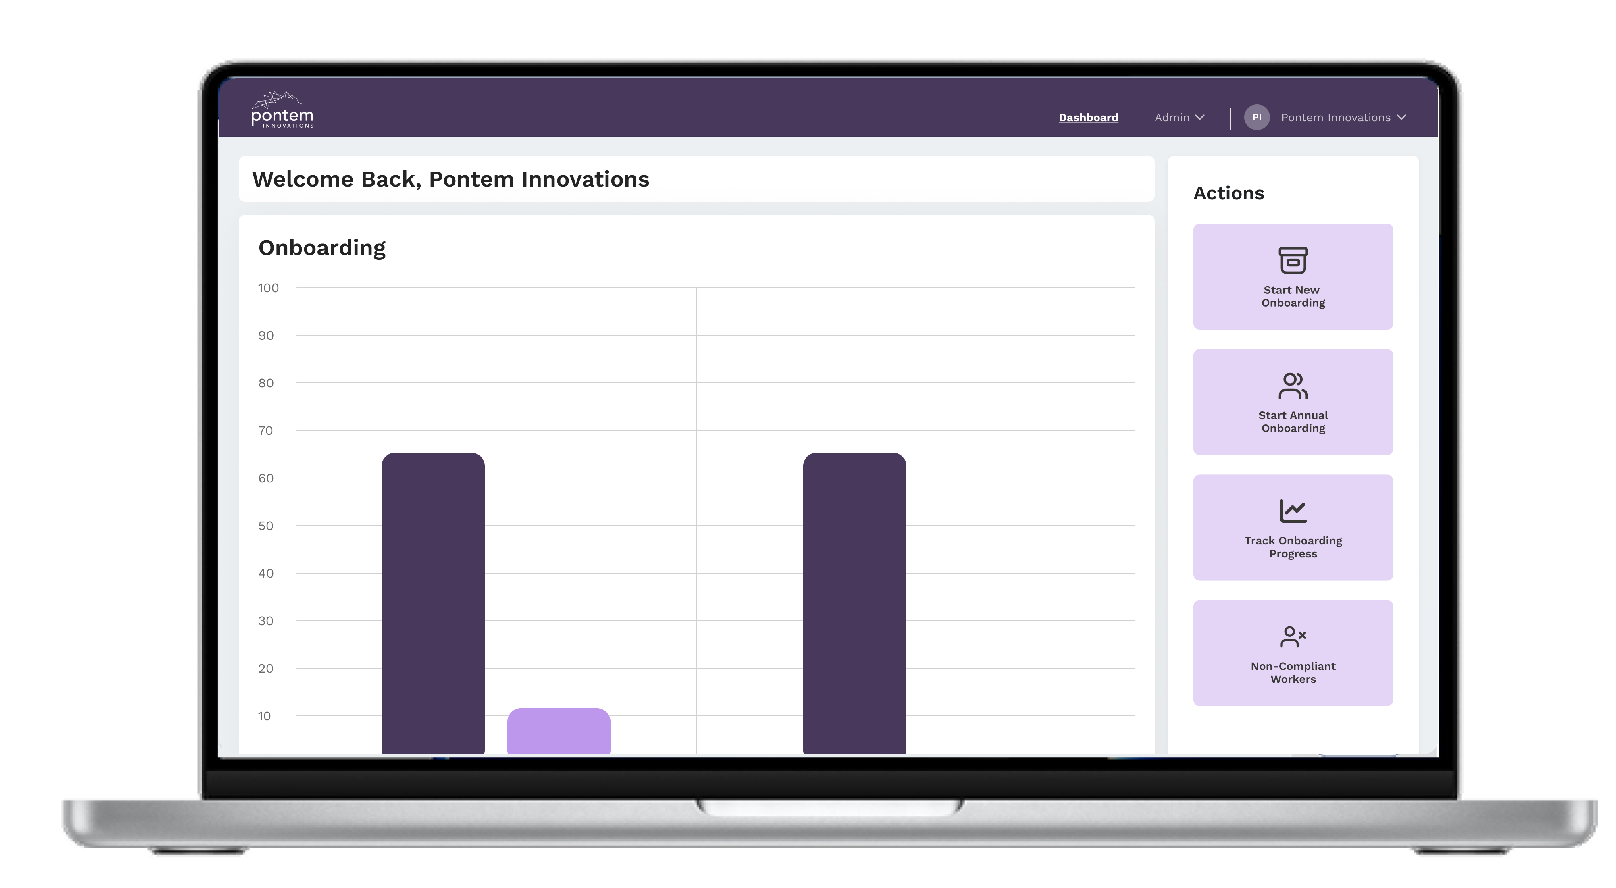
Transform Data Into
Actionable Insights
Business intelligence solutions connect and organize information from multiple sources, allowing organizations to explore trends, answer questions, and gain deeper insight into operations, finances, programs, and performance.
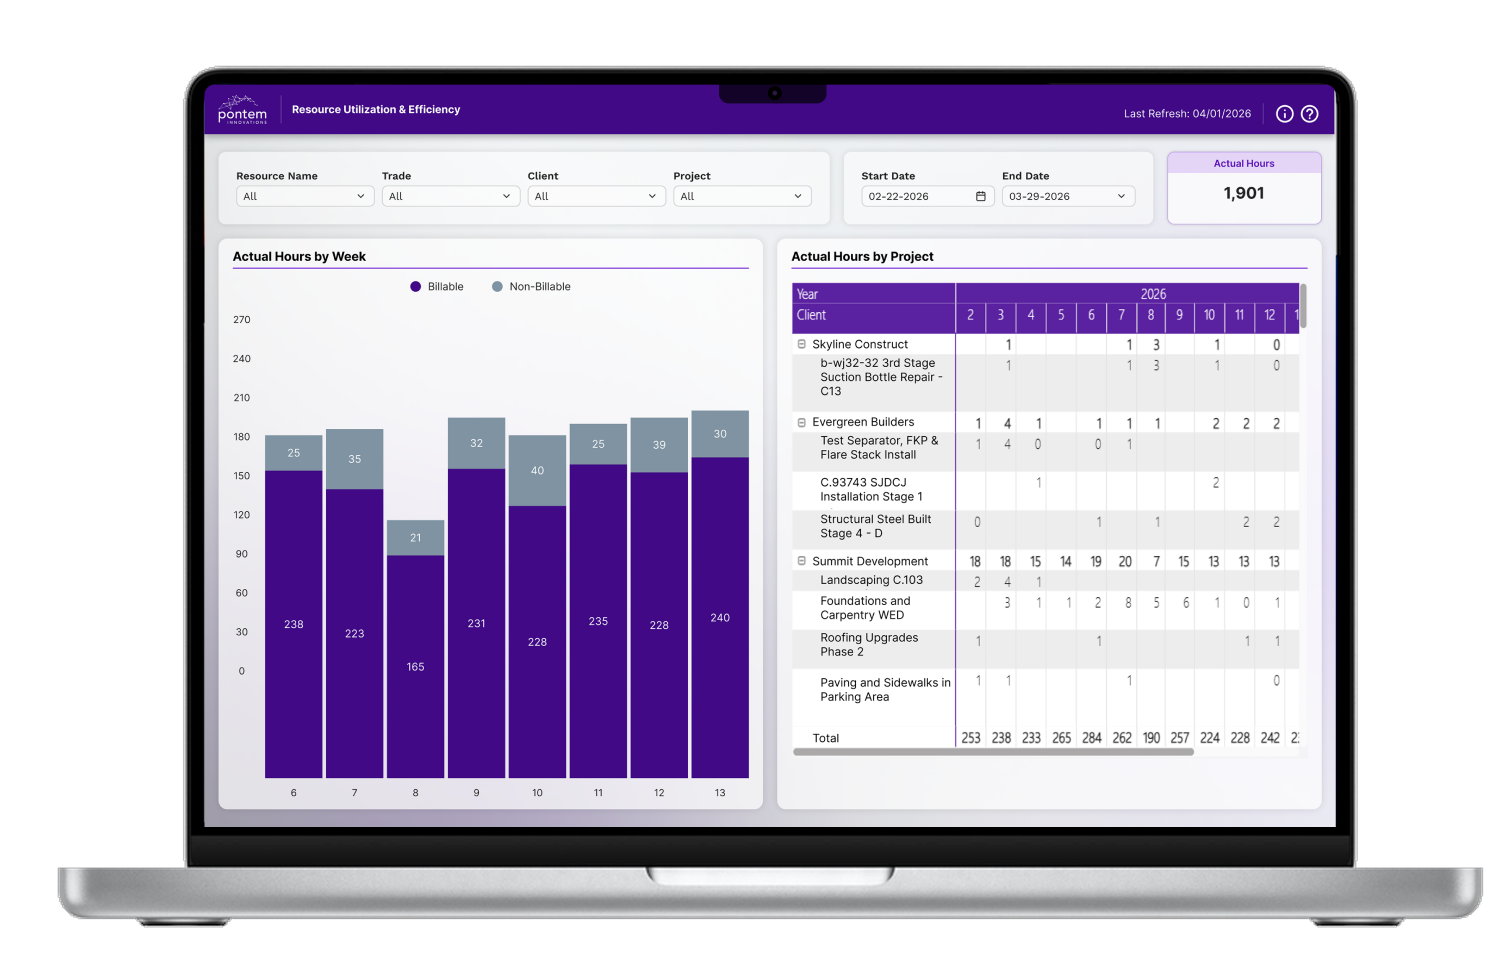
Monitor the Metrics That Drive Results
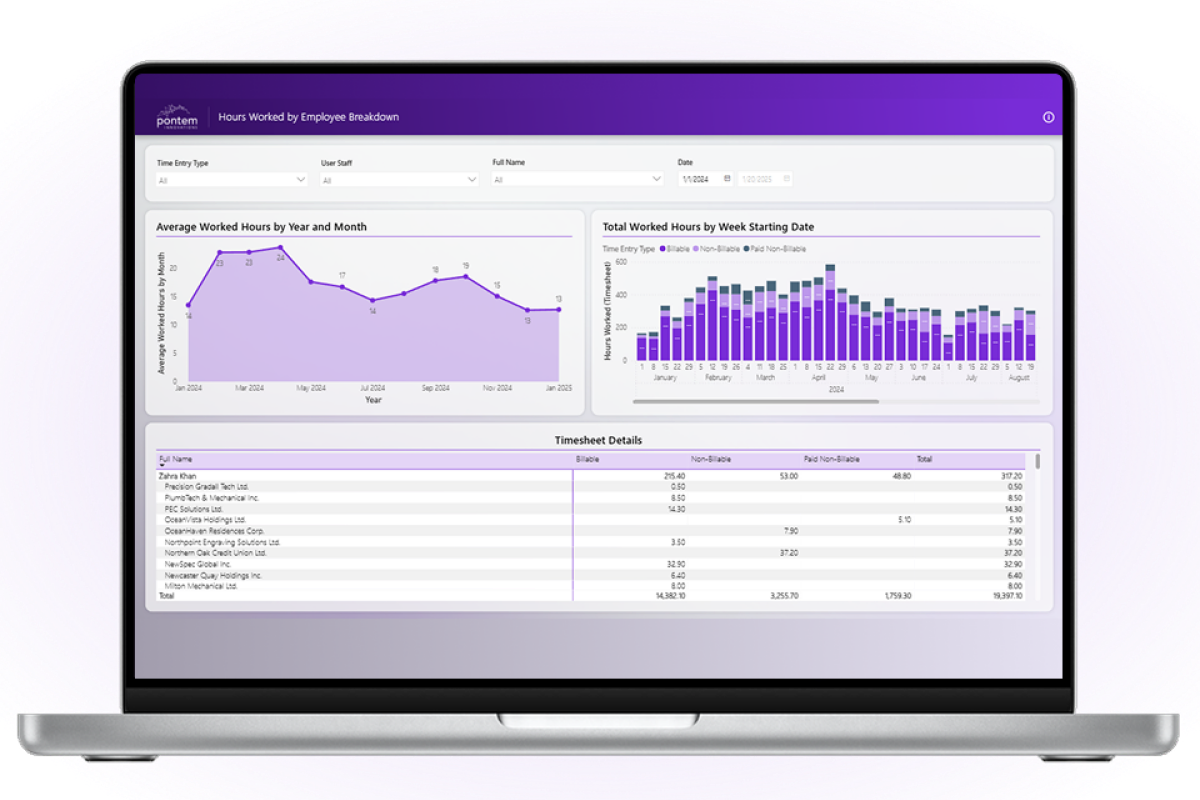
Operational reporting provides managers and frontline leaders with timely information about utilization, capacity, projects, workloads, and performance. The goal is to identify issues earlier and support day-to-day decision-making.
Build the Foundation
for Effective AI
Many organizations are eager to adopt AI, but AI is only as effective as the information it can access. When data is fragmented or inconsistent, AI produces less reliable results. Strong reporting environments ensure both people and AI are working from trusted information.
Pontem recommends solutions based on your goals, budget, existing systems, and organizational maturity.
Operational reporting was fragmented and difficult to access.
Centralized reporting environment and executive dashboards.
Improved visibility into business performance and faster decision-making.

Exposure hours and revenue data were spread across multiple systems.
Unified reporting and operational intelligence platform.
Better operational visibility and reduced reporting effort.
Budgeting and forecasting processes were highly manual.
Custom forecasting and reporting solution.
Reduced administrative effort and increased planning capacity.
Assess fit, understand challenges and opportunities.
Define requirements and design the right solution.
Build, test, and launch the solution.
Maintain, improve, and support your solution.
Whether you’re struggling with manual reporting, disconnected systems, or limited visibility into performance, we’ll help you determine the most practical path forward.
START NOW